

For data scientists, data engineers, data analysts, and GenAI specialists, Visual Studio Code offers a powerful, lightweight, and customizable platform for data preparation and model building. By pairing the built-in Jupyter Notebook support with essential extensions like Data Wrangler, you can streamline your entire workflow — from data exploration to code generation and version control.
Follow these steps to setup your Visual Studio Code environment,
Install Visual Studio Code
Follow this link to download and then install Visual Studio Code.
Enable Jupyter Notebook in Visual Studio Code
To enable and use Jupyter Notebooks in Visual Studio Code, you need to install the official Jupyter and Python extensions.
Step 1: Install Required Extensions
- Open Visual Studio Code.
- Go to the Extensions view by clicking the square icon on the side bar or by pressing Ctrl+Shift+X.
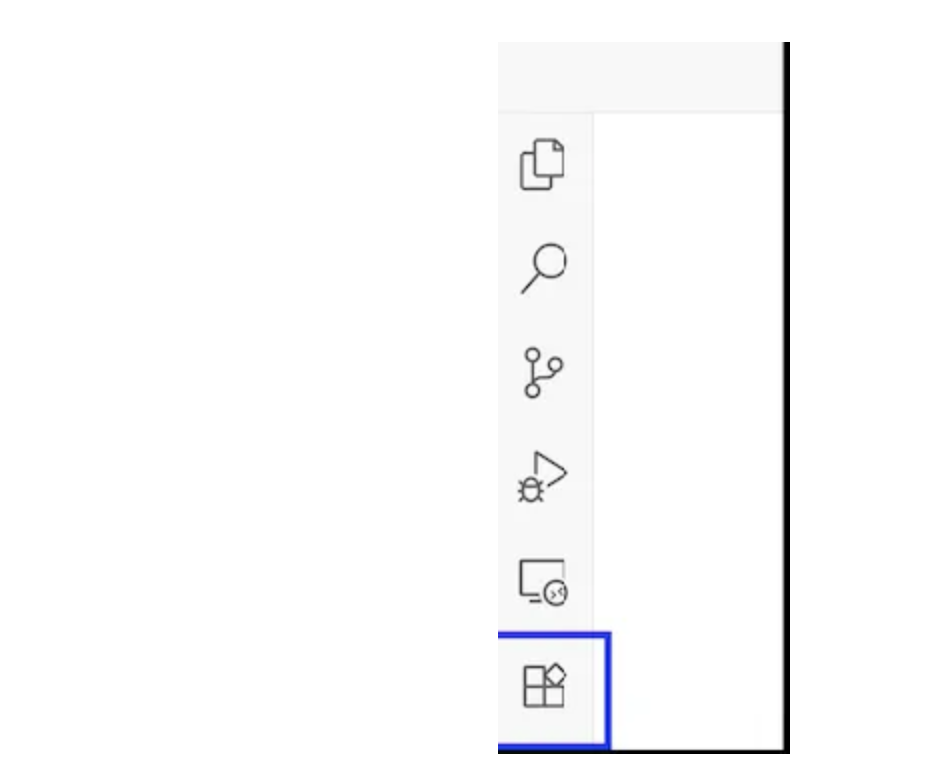
- Search for Jupyter and select the official extension from Microsoft, then click Install.

- Repeat this process for the Python extension, which is required for connecting to a Python environment and enables features like IntelliSense (auto-code-completion, syntax highlighting etc.)

Step 2: Create Jupyter Notebook
- Open the Command Palette and run the Create: New Jupyter Notebook command. This will open a new, blank .ipynb file. The Command Palette in VS Code can be opened using the following keyboard Shortcut:
Windows/Linux: Press Ctrl+Shift+P
macOS: Press Command+Shift+P
Step 3: Create & Activate Virual Environment
Create a virtual environment: Open your terminal or command prompt and run the following command. The name .venv is a common convention, but you can choose any name you like:
python3 -m venv .venvActivate the virtual environment: Activation modifies your command prompt to show the environment’s name, confirming that any subsequent commands will be isolated within it. The command depends on your operating system and shell:
- Activate (macOS/Linux): source .venv/bin/activate
- Activate (Windows Command Prompt): .venv\Scripts\activate.bat
- Activate (Windows PowerShell): .\.venv\Scripts\Activate.ps1
Step 4: Connect Python Kernel to Jupyter Notebook
- In the top-right corner of the notebook, click the kernel picker to confirm that the correct Python environment is selected.
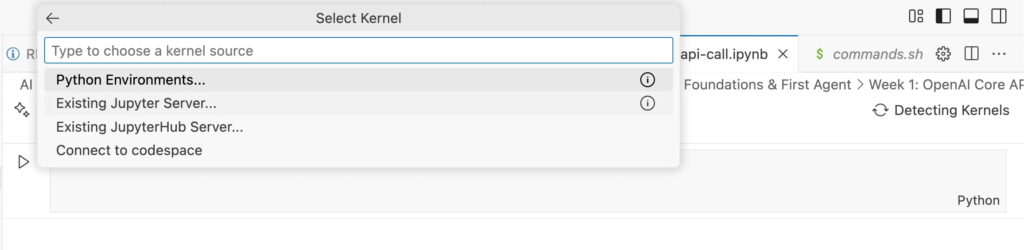
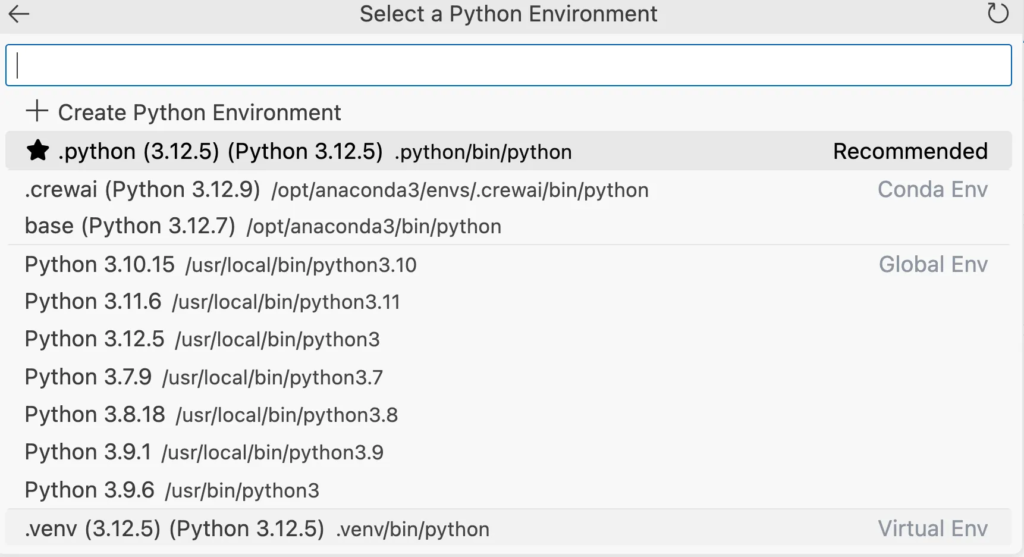
- Select the virtual environment (.venv) you created in previous step (create and activate virtual environment). Select the bottom 1st one in our case.
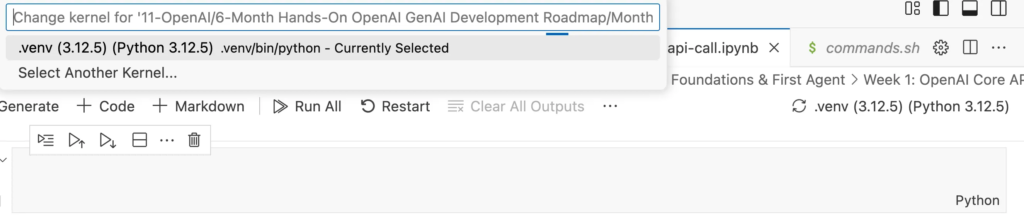
- Once python kernel is linked then you can click on kernel picker again to valiadate. It must be marked as ‘Currently Selected’.
Step 5: Run Jupyter Notebook
- You can now type Python code into a cell and execute it by clicking the Run icon next to the cell or by pressing Shift+Enter.

- The output will appear directly below the code cell, and you can add more code or Markdown cells as needed.

Optional: Install Python Packages using requirements.txt
One of the most important best practices is using a requirements.txt file to manage your project’s dependencies. This text file lists all the packages and their exact versions that your project needs, ensuring consistency across different machines and collaborators.
- Create your requirements.txt file
- Add the package name and an optional version to the file.
matplotlib==3.2.2- Install the packages from the file
With the virtual environment active, run the following command. The -r flag tells pip to read the packages from the specified file:
pip install -r requirements.txtBest practices
- The requirements.txt file should be included in your version control system (like Git) so that other developers can easily replicate the environment.
- The virtual environment directory itself (.venv/) should be excluded, typically by adding it to a .gitignore file.
- To get an exact list of all installed packages, including dependencies like NumPy that Matplotlib or any other packages relies on, you can run pip freeze after installing your primary packages manually and save this list to a new file
pip freeze >> requirements.txtSetting up & using Data Wrangler in a VS Code Jupyter Notebook
Data Wrangler provides an interactive, Excel-like grid view of your datasets, such as Pandas DataFrames. This allows you to quickly sort, filter, and inspect your data, offering a transparent way to understand its structure and content.
This block demonstrates how to create a Pandas DataFrame and a Matplotlib plot in a Jupyter Notebook within Visual Studio Code. It then shows how to use the VS Code Data Wrangler extension for interactive data exploration, visualization, and code generation.
Step 1: Install Data Wrangler VS Code Extension
- Open Visual Studio Code.
- Go to the Extensions view by clicking the square icon on the side bar or by pressing Ctrl+Shift+X.
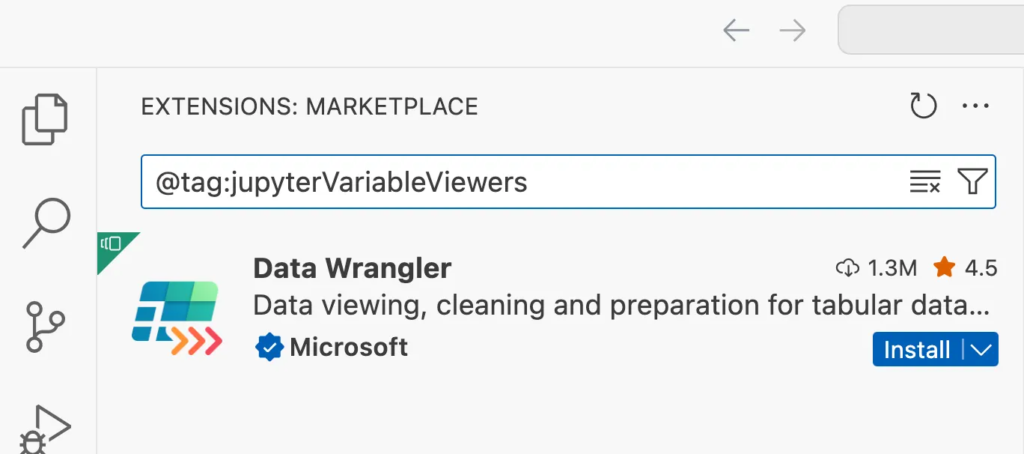
- Search for Data Wrangler and select the official extension from Microsoft, then click Install.
Step 2: Create and Execute the Data Setup Cell
Create a new Jupyter Notebook (.ipynb file) in VS Code and add the following code to the first cell. This cell uses the Pandas library to create a DataFrame from a dictionary, a standard practice for structuring data for analysis.
import pandas as pd

data = {
    'Product_ID': range(4),
    'Product_Name': ['A', 'B', 'C', 'D'],
    'Product_Category': ['Electronics', 'Electronics', 'Clothing', 'Clothing'],
    'Price': [30, 40, 41, 47],
    'Stock': [50, 60, 70, 80]
}

df = pd.DataFrame(data)
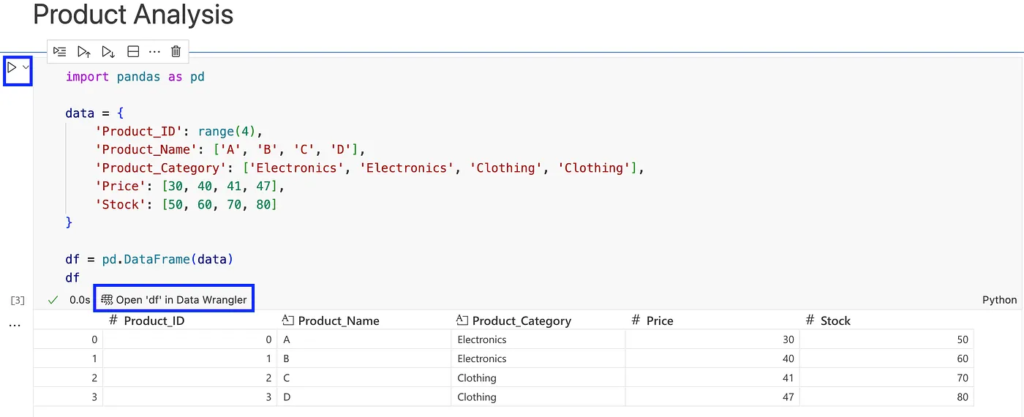
df- Execution: Run this cell by clicking the “Run” icon next to it or by pressing Shift+Enter
- Result: The DataFrame will be displayed as a formatted table in the output area of the cell. Below the output, you will see a button labeled “Open ‘df’ in Data Wrangler”, which enables the next step.
Step 3: View the DataFrame in Data Wrangler
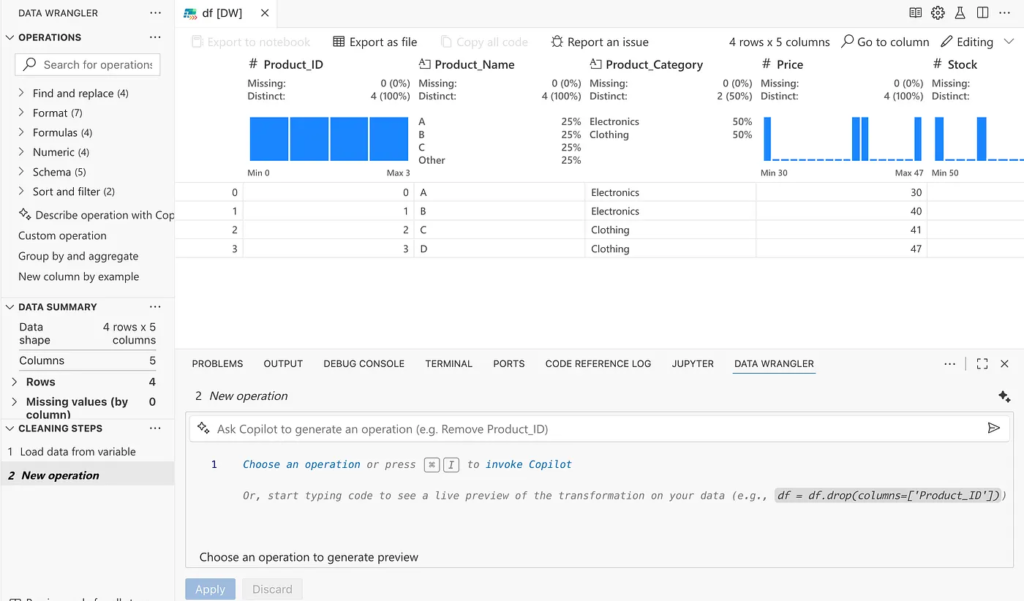
Clicking the “Open ‘df’ in Data Wrangler” button will open a new tab with an interactive, rich grid view of your data. In this sandboxed environment, you can:
- Inspect the entire dataset in an Excel-like interface.
- Use built-in operations like filtering, sorting, or handling missing values.
- View summary statistics and quick insights for each column.
- Have Data Wrangler automatically generate the corresponding Python code for any cleaning steps you perform visually.
Setting up Matplotlib for Data Visualization
Matplotlib is a very popular python package for data visualization, used widely across various technical and educational fields.
Step 1: Install Matplotlib package
- Add Matplotlib to requirements.txt
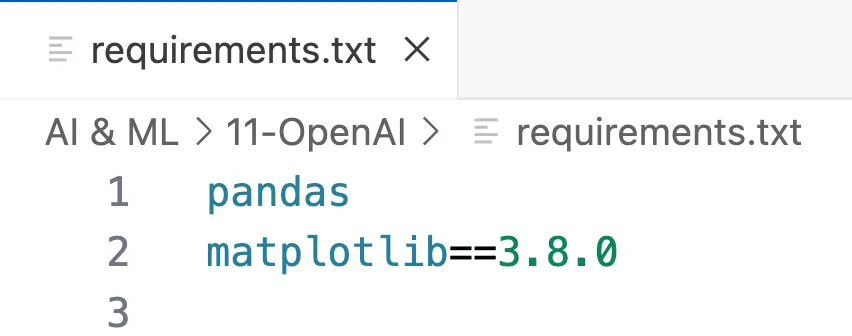
- Install dependencies from the file pip install -r requirements.txt
Step 2: Create and Execute the Data Visualization Cell
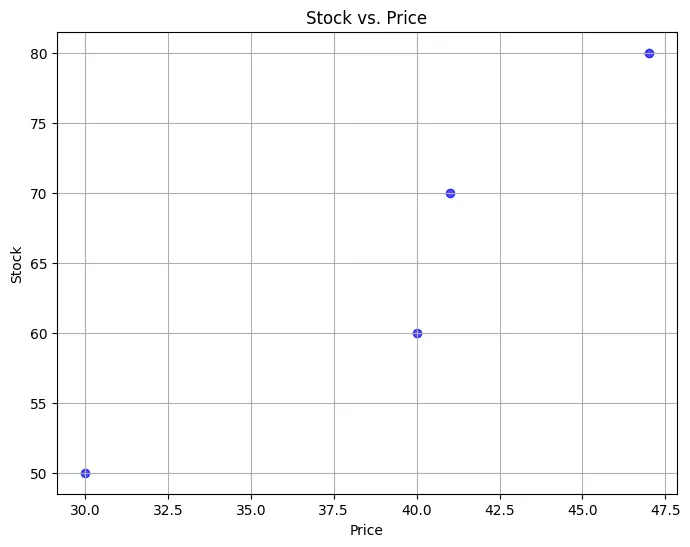
Add a new cell to your notebook and include the following code. This cell imports the pyplot module from Matplotlib and creates a scatter plot to visualize the relationship between the Price and Stock columns of your DataFrame.
import matplotlib.pyplot as plt

# Create the scatter plot
plt.figure(figsize=(8, 6))
plt.scatter(df['Price'], df['Stock'], color='blue', alpha=0.7)

# Add titles and labels for clarity
plt.title('Stock vs. Price')
plt.xlabel('Price')
plt.ylabel('Stock')
plt.grid(True)

# Display the plot
plt.show()- Execution: Run this cell to generate the scatter plot directly below the code cell in your notebook.
Other Python packages for Data-Driven Professions
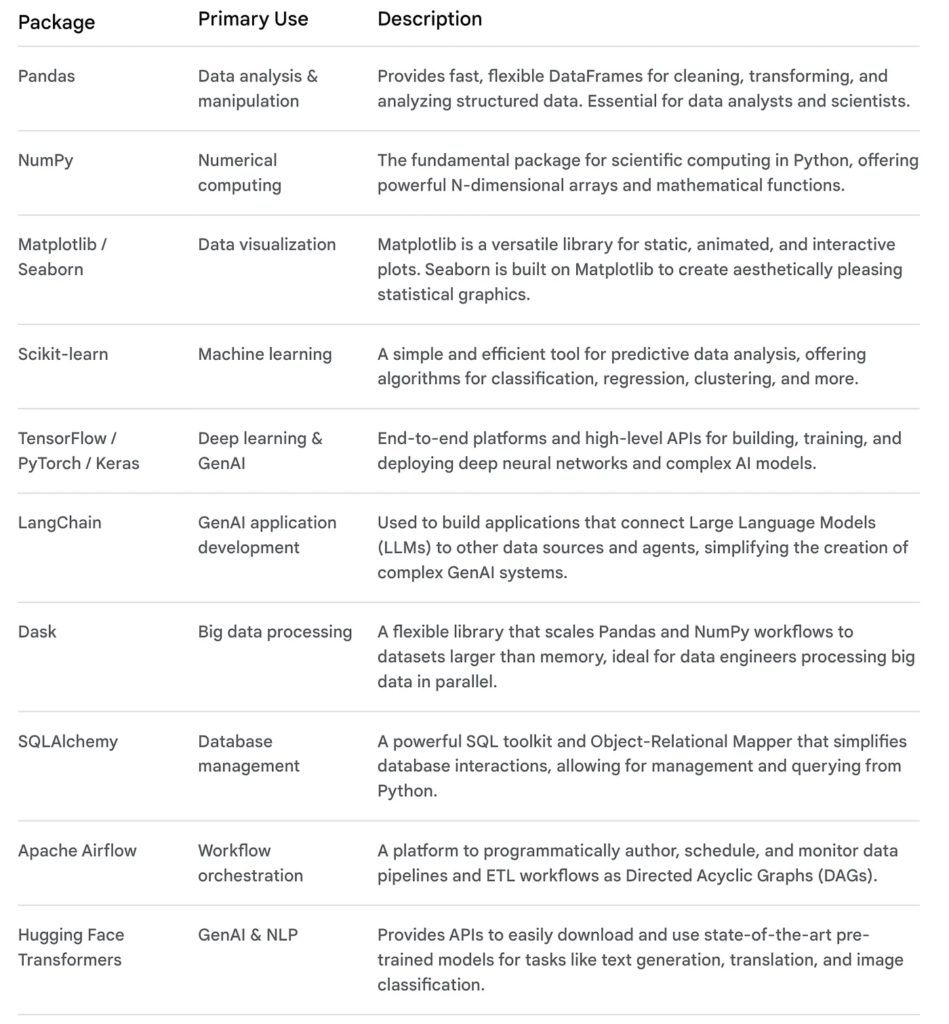
A core set of Python packages and VS Code extensions is recommended. This setup streamlines tasks from data cleaning to model deployment and AI-assisted coding.
Found this guide useful? If so, please consider showing your support by following, liking, and sharing it with your network. Your engagement helps us create more valuable content for the data science community!.
Happy Learning!
