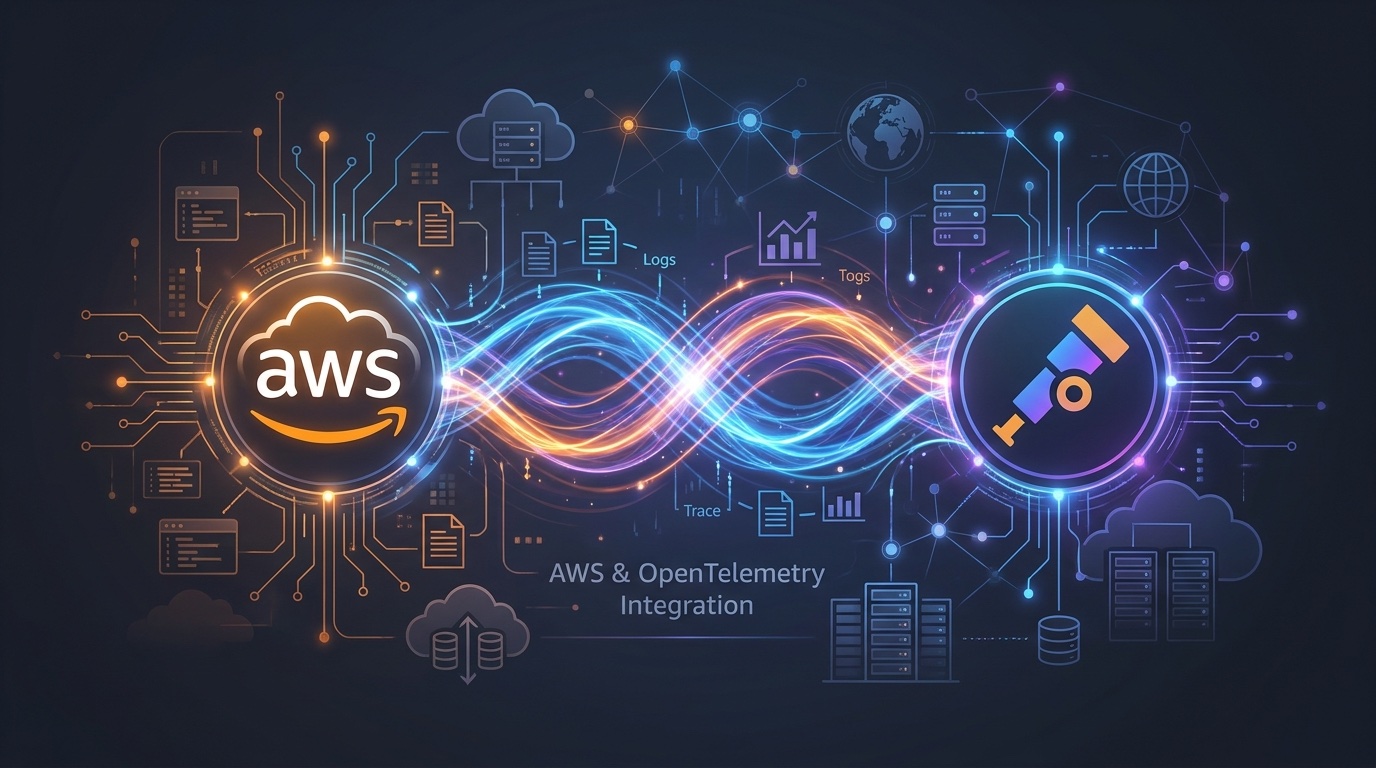
The full story — from “what even is observability” to why your Kubernetes cluster will thank you for this
What is observability and why should you care?
Imagine you own a restaurant. At the end of service you hear “table 7 is unhappy.” But you don’t know why. Was the food cold? Did it take 45 minutes? Was there a mix-up in the kitchen? You’re flying blind.
Observability is your restaurant’s complete visibility into what happened, when, and why — before the customer complained. In software, it means the same thing: you should be able to ask any question about your system’s behavior and get a real answer, even if you never anticipated that question when you built the system.
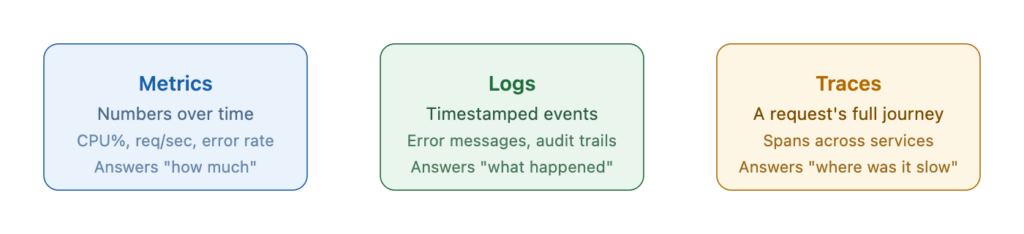
There are three classical “pillars” of observability in software:
Real scenario
Your e-commerce checkout is slow on Black Friday. Metrics show high CPU on the payment service. Logs show a database timeout. Traces show the timeout happening specifically when the promo-code lookup service is called — which is hitting a Redis instance in a different region. Without all three pillars connected, you’d spend hours guessing.
The “Tower of Babel” problem in monitoring
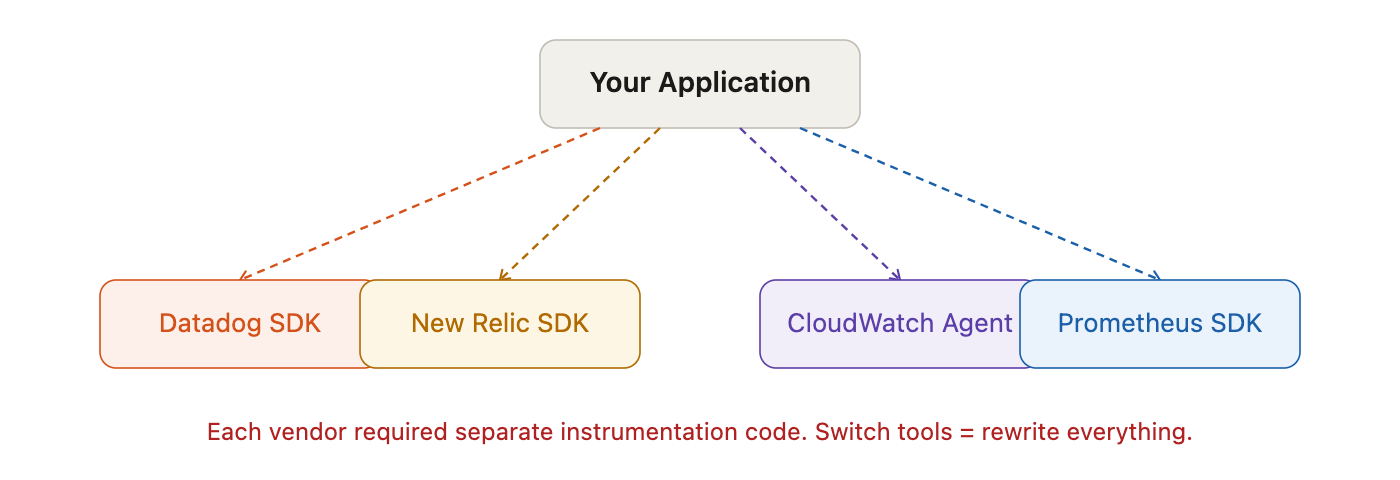
Before 2019, every monitoring vendor spoke a different language. And your application had to learn all of them.
Think of it this way: imagine you’re a chef, and every restaurant you work at requires you to write recipes in a completely different format. McDonald’s wants JSON. Michelin-star restaurants want French handwriting. Food trucks want Instagram captions. You’re the same chef making the same food but you’re wasting half your day on paperwork.
That was the reality for software engineers trying to add observability. You had to instrument your application separately for:
- Datadog’s custom agent
- New Relic SDK
- Prometheus client libraries
- AWS CloudWatch agent
- Jaeger for tracing
- Zipkin for tracing
- StatsD for metrics
- Elasticsearch APM
The pain points
Vendor lock-in at the code level. If you instrumented your app with Datadog’s SDK and later wanted to switch to New Relic, you had to rip out all your instrumentation code and rewrite it.
The “frankenstack” problem. A company using 3 monitoring tools had 3 different agents running on every server, each collecting overlapping data in different formats. This wasted compute and caused weird interference issues.
No consistent context across tools. Your metrics tool and your tracing tool didn’t know about each other. If your latency spiked, you couldn’t easily jump from the metric to the specific trace that showed you why.
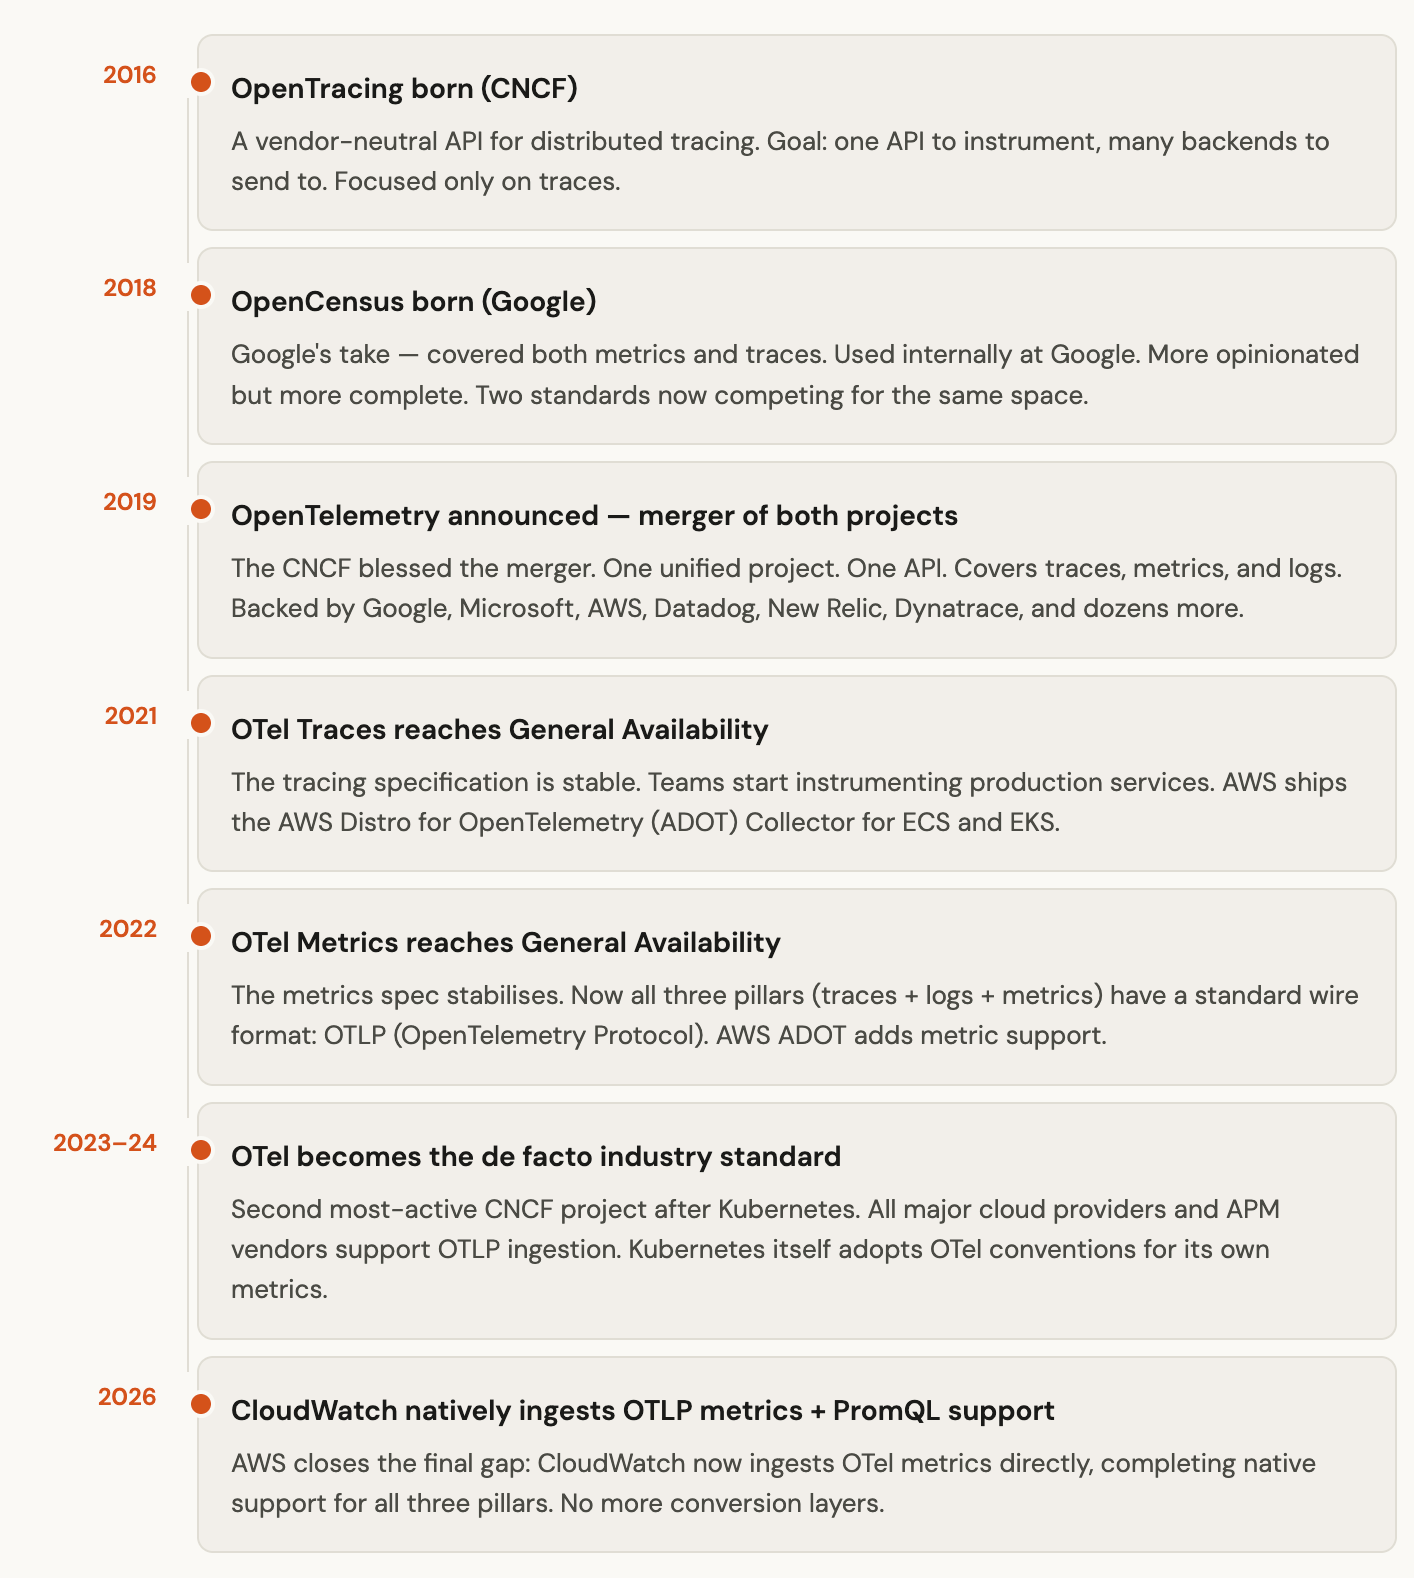
How OpenTelemetry was born and evolved
Two separate open-source projects,
- OpenCensus (from Google) and
- OpenTracing (from the wider community)
both were trying to solve the same problem, but in competing ways. In 2019, they merged into one: OpenTelemetry (OTel).
Think of OpenTelemetry (OTel) as the USB standard for observability. Just as USB let you plug any device into any computer without caring about the manufacturer, OTel lets you instrument your app once and send the data anywhere i.e. Datadog, New Relic, Prometheus, CloudWatch, or your own system.
What is the OTel Collector?
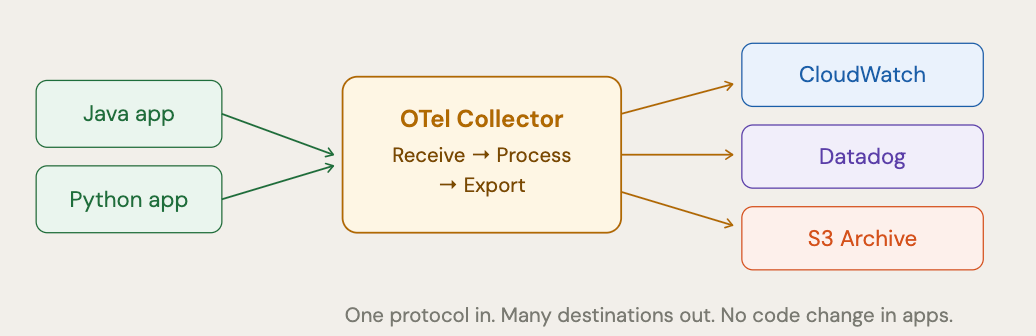
One of OTel’s most important pieces is the Collector , a standalone process that sits between your apps and your monitoring backends. Think of it like a universal translator for telemetry data.
Analogy: Your app speaks one language (OTLP). The Collector receives it, can process or filter it, and then forwards it to many destinations simultaneously — CloudWatch, Datadog, and an S3 archive at the same time. Your app never needs to know or care about the destinations.
The Old Way: A House of Duct Tape
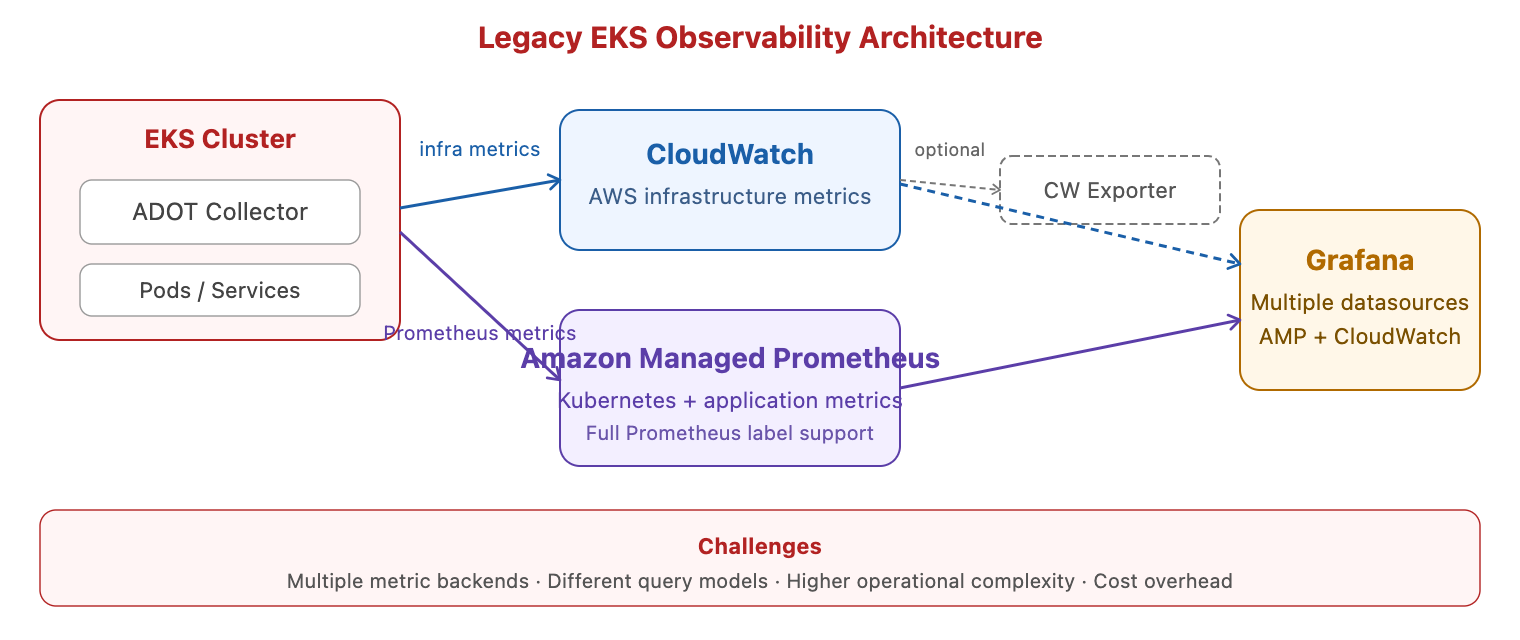
Even after OTel existed, getting it to work well with CloudWatch was a multi-step, fragile process. Here’s what teams actually had to do.
Real-world setup — a company running microservices on EKS wanting metrics in CloudWatch
Imagine you’re the platform team at a mid-sized company. You have 20 microservices on EKS. Management wants everything in CloudWatch (it’s the company standard). But your Kubernetes workloads generate high-cardinality metrics with dozens of labels. Here was your Tuesday afternoon…
Step 1: Deploy the AWS Distro for OpenTelemetry (ADOT) Collector
You’d deploy the ADOT Collector as a DaemonSet on your EKS cluster. This agent would collect metrics from your pods via OTel SDKs. So far so good.
Step 2: Hit the 30-dimension wall
CloudWatch custom metrics support a maximum of 30 dimensions (what OTel calls “labels”). But a typical Kubernetes pod metric has: namespace, pod name, container name, node name, deployment, replica set, cluster name, region, account ID, app version, environment, team, cost center… That’s already 13. Add your custom business labels and you’re well over 30.
The forced choice
You had to deliberately drop labels before sending to CloudWatch. Which ones? Good luck deciding. Drop the wrong one and you lose the ability to filter by that dimension forever — or until you redeploy with a different config.
This is like buying a car and being told: “You have 10 cup holders total. Passengers, doors, windows, and seats all count against that 10.” You end up removing the passenger seat so you can have more cup holders.
Step 3: Set up a parallel Prometheus stack for the rest
Because CloudWatch couldn’t hold all your high-cardinality container metrics, most teams ran Amazon Managed Service for Prometheus (AMP) as a second metrics store alongside CloudWatch. Now you have two systems to maintain, two billing lines, and your on-call engineer needs to know both systems to debug incidents.
Step 4: The Prometheus CloudWatch Exporter
Your Grafana dashboards lived in the Prometheus world. But AWS vended metrics (your ALB request count, your RDS latency, your Lambda duration) only lived in CloudWatch. So you ran a Prometheus CloudWatch Exporter — a small service that periodically called CloudWatch’s GetMetricData API and scraped the results into Prometheus format.
What this exporter actually cost you
Money: CloudWatch charges per API call. Scraping 500 metrics every 60 seconds is ~720,000 API calls per day. At scale this adds up fast.
Latency: The scrape interval means your “real-time” dashboard was actually up to 60 seconds stale.
Ops burden: One more thing to deploy, monitor, and keep running. When the exporter crashes at 2am, your dashboards go blank.
Step 5: No PromQL in CloudWatch
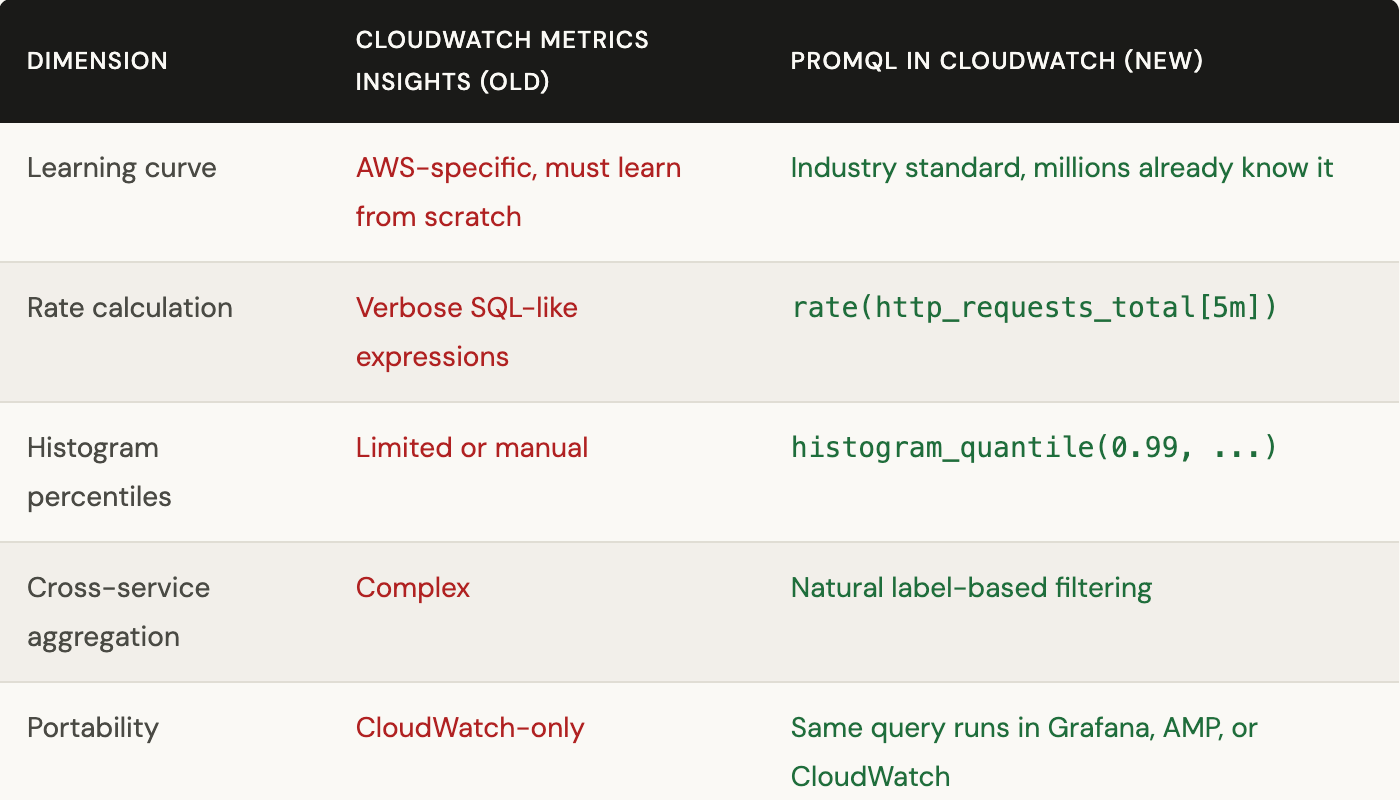
CloudWatch had its own query language: CloudWatch Metrics Insights (a SQL-like syntax). Your team coming from a Prometheus background now had to learn an entirely different language to write the same queries they already knew. A simple rate-of-change query that takes 2 lines in PromQL took 15 lines in Metrics Insights.
“The irony: you bought into OTel for standardisation — and ended up with more moving parts than before.”
What OTel Actually Solves
OpenTelemetry’s core promise is elegantly simple: instrument once, send anywhere. But its real value runs deeper than that.
Problem 1: Vendor lock-in Solved by standardised instrumentation
With OTel SDKs in your code, you add one instrumentation library. When you want to switch from Datadog to CloudWatch (or add a second backend), you change your Collector config — not your application code.
Problem 2: No consistent context — Solved by semantic conventions
OTel defines semantic conventions — a dictionary of standard attribute names. Everyone agrees that a Kubernetes pod’s name is always k8s.pod.name, an HTTP status code is always http.response.status_code, and a database name is always db.name. This means your metrics, logs, and traces from different services all use the same vocabulary, making correlation automatic.
Why this matters — the correlation story
Your trace shows a slow span on the payment-service. With semantic conventions, that span has a label k8s.pod.name=payment-service-7d4b9c. You can instantly jump from that trace to the metrics for that exact pod, which show memory pressure. Then to the logs from that pod, which show GC pauses. One click at each step, because they all share the same attribute name.
Without semantic conventions, the trace might call it “pod”, the metrics might call it “pod_name”, and the logs might call it “kubernetes_pod”. Correlation requires a human to manually wire these up.
Problem 3: Pipeline rigidity — Solved by the Collector architecture
The OTel Collector pipeline (receive → process → export) lets you do powerful things to your data before it reaches a backend: sample high-volume traces, drop low-value metrics, add extra attributes, route different signals to different destinations. None of this requires touching your application.
# Example: OTel Collector config
# Route traces to Jaeger, metrics to CloudWatch, logs to S3
exporters:
  awscloudwatchmetrics:
    region: us-east-1
  jaeger:
    endpoint: jaeger.internal:14250
  awss3:
    s3_bucket: my-logs-archive

service:
  pipelines:
    metrics:
      exporters: [awscloudwatchmetrics]
    traces:
      exporters: [jaeger]
    logs:
      exporters: [awss3]
Why CloudWatch needed to adopt OTel and what took so long
CloudWatch had been AWS’s observability platform since 2009. It was designed for a world of EC2 instances and RDS database not 500-pod Kubernetes clusters with 150 labels per metric.
The competitive pressure
By 2023, OTel had become the second most-active project in the Cloud Native Computing Foundation (CNCF) — right after Kubernetes itself. Every major monitoring vendor (Datadog, Grafana, New Relic, Dynatrace) had native OTLP ingestion. Google Cloud’s operations suite supported it. Azure Monitor supported it. CloudWatch was a conspicuous holdout ,the biggest cloud platform in the world, without native OTel metrics ingestion.
For AWS customers running Kubernetes workloads, this created a real choice: use the native AWS tooling and lose observability quality, or run a parallel Prometheus stack and deal with the complexity. Many teams chose the latter which means AWS was losing observability budget and mindshare to third-party vendors.
The cardinality gap was the hardest part
CloudWatch’s 30-dimension limit wasn’t an arbitrary decision it reflected a fundamental architecture choice. CloudWatch was built around the concept of dimensions as a small, fixed set of metadata per metric. This works perfectly for a metric like AWS/RDS: CPUUtilization with dimensions DBInstanceIdentifier=prod-db-01.
But a Kubernetes metric might legitimately need to carry: cluster, namespace, pod, container, node, deployment, replica set, service account, priority class, and then 10+ custom business labels. You’re at 20+ labels for a normal metric. Add OTel semantic convention attributes on top and you’re at 35–40.
What is cardinality? Cardinality is the number of unique combinations of label values. If you have 1,000 pods each with a unique pod name, that’s 1,000 unique time series. With 10 labels each having 10 unique values, you have 10^10 (10 to power 10) possible combinations. High-cardinality systems require fundamentally different storage architecture than low-cardinality ones. CloudWatch’s old metrics store was not designed for this.
The PromQL story
PromQL (Prometheus Query Language) has become the de facto standard query language for time-series metrics just as SQL is for relational data. If your team knows Prometheus, they know PromQL. If you hire a senior SRE, they know PromQL. It’s taught in Kubernetes courses, it powers Grafana dashboards everywhere, and it’s what your team uses in runbooks.
CloudWatch Metrics Insights is powerful, but it’s proprietary. Every engineer who joins your team has to learn it from scratch. Adding PromQL support to CloudWatch means your existing knowledge — your dashboards, your alert expressions, your runbooks all port over directly.
Container Insights for EKS Where the Rubber Meets the Road
Container Insights is CloudWatch’s feature for monitoring containerised workloads. Its adoption of OTel is the most concrete, immediately useful part of this announcement for anyone running Kubernetes on AWS.
The concrete scenario — an EKS cluster at 2am
Your e-commerce platform runs on EKS. It’s Black Friday, 2am. Orders are failing. Your on-call engineer opens their laptop.
Old world: a multi-tool investigation
The engineer opens CloudWatch to check AWS-level metrics (ALB request rate, RDS connections). Something looks wrong with the order-processing service. They switch to Grafana (backed by AMP) to check Kubernetes pod metrics. Different login, different dashboard. They find a pod with high memory. They check the CloudWatch Logs Insights for that pod’s logs — a third interface, a third query syntax.
At each step, they’re manually correlating: “The ALB shows errors starting at 01:47. Let me check Grafana for pods at 01:47. The pod metric shows a spike on order-worker-7f8d. Now back to CloudWatch to look at logs for that pod name.”
This mental context-switching under pressure at 2am is where MTTR (mean time to resolve) blows up from 15 minutes to 2 hours.
New world: one store, one query language
With Container Insights now emitting OTel metrics, everything is in CloudWatch. AWS vended metrics (ALB, RDS, Lambda) are automatically enriched with the same labels as your pod metrics. The engineer can write one PromQL query that spans both:
# Find pods with high CPU in namespaces where the error rate is elevated
container_cpu_usage_seconds_total{
  k8s.namespace.name=~"orders|payments",
  @aws.tag.Environment="production"
}
That query returns pod-level CPU data filtered by namespace and by an AWS resource tag — something that was physically impossible before because the tag lived in CloudWatch and the pod metric lived in Prometheus.
The AWS Resource Enrichment Feature
Every metric ingested via OTLP now gets automatically tagged with context that CloudWatch pulls from AWS Resource Explorer:
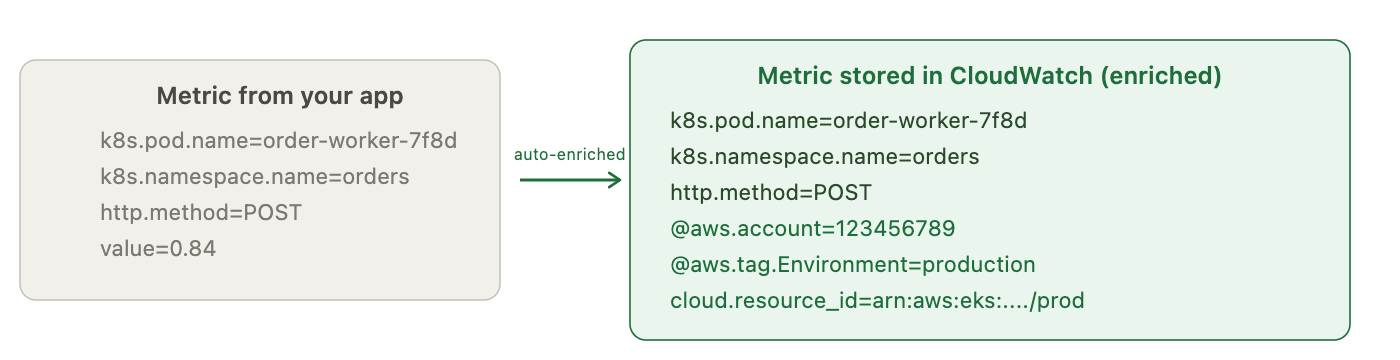
Why does this matter? Because it means a platform team managing multiple AWS accounts can now filter metrics by account, by environment tag (Environment=production), by cost centre tag, or by application tag — all without asking every development team to manually add those labels to their code. The platform team sets the tags in AWS, and they flow through automatically.
What changes for your team, end to end
Let’s make it concrete. Here’s the same EKS + observability setup
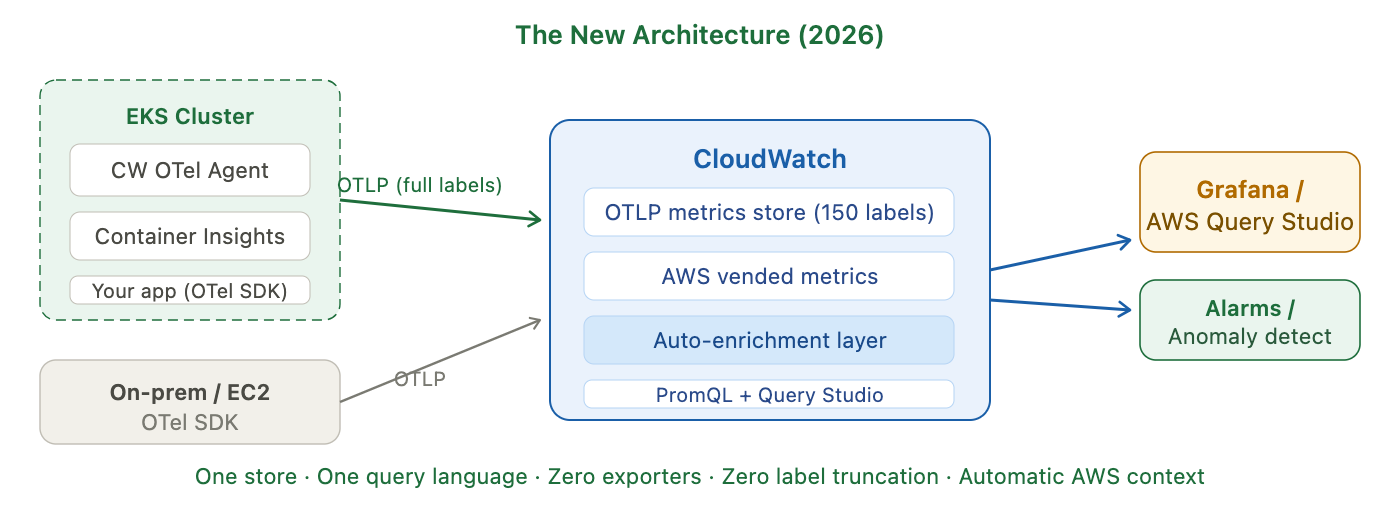
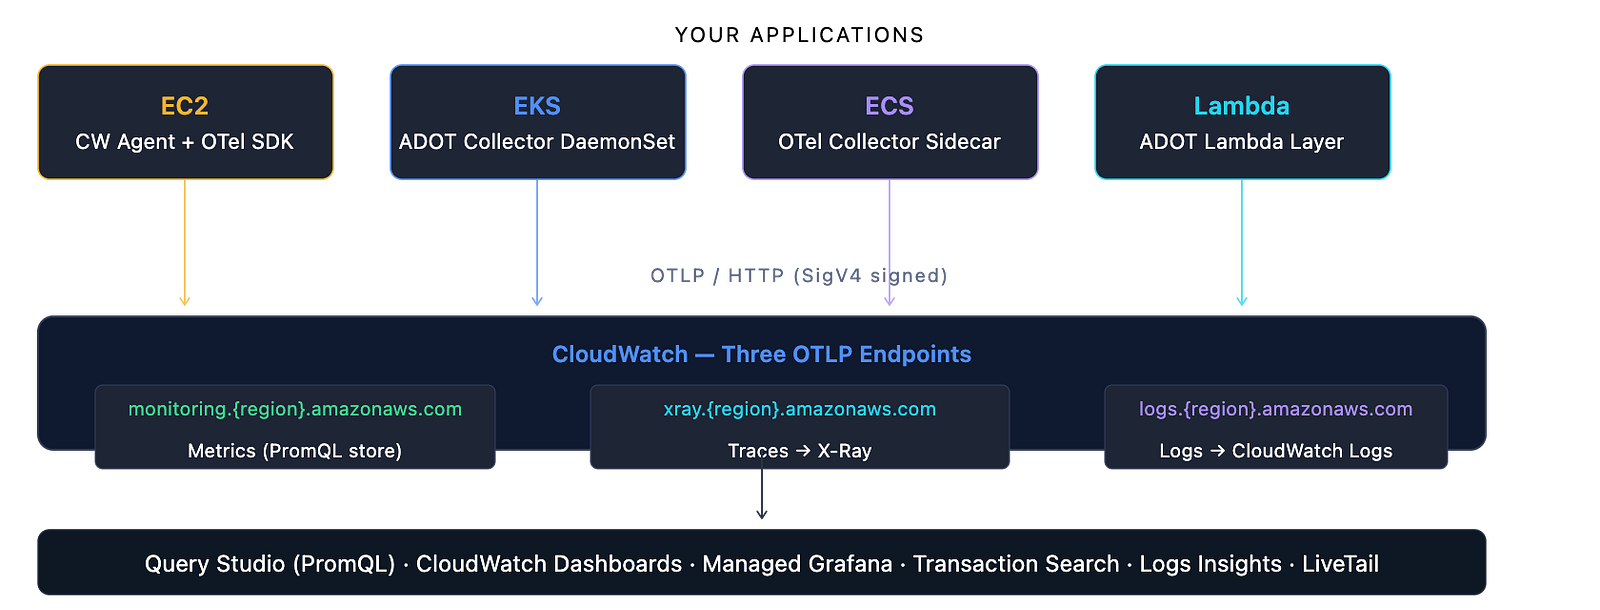
AWS ADOT collector and AWS CloudWatch agents can be replaced with more generic / open source / non vendor lock-in tools. In fact, many large enterprises intentionally avoid tight coupling with ADOT and CW agent.
ADOT collector and CloudWatch agent both can be replaced with Fluent Bit or OpenTelemetry (OTel) Collector.
The summary: what actually changes
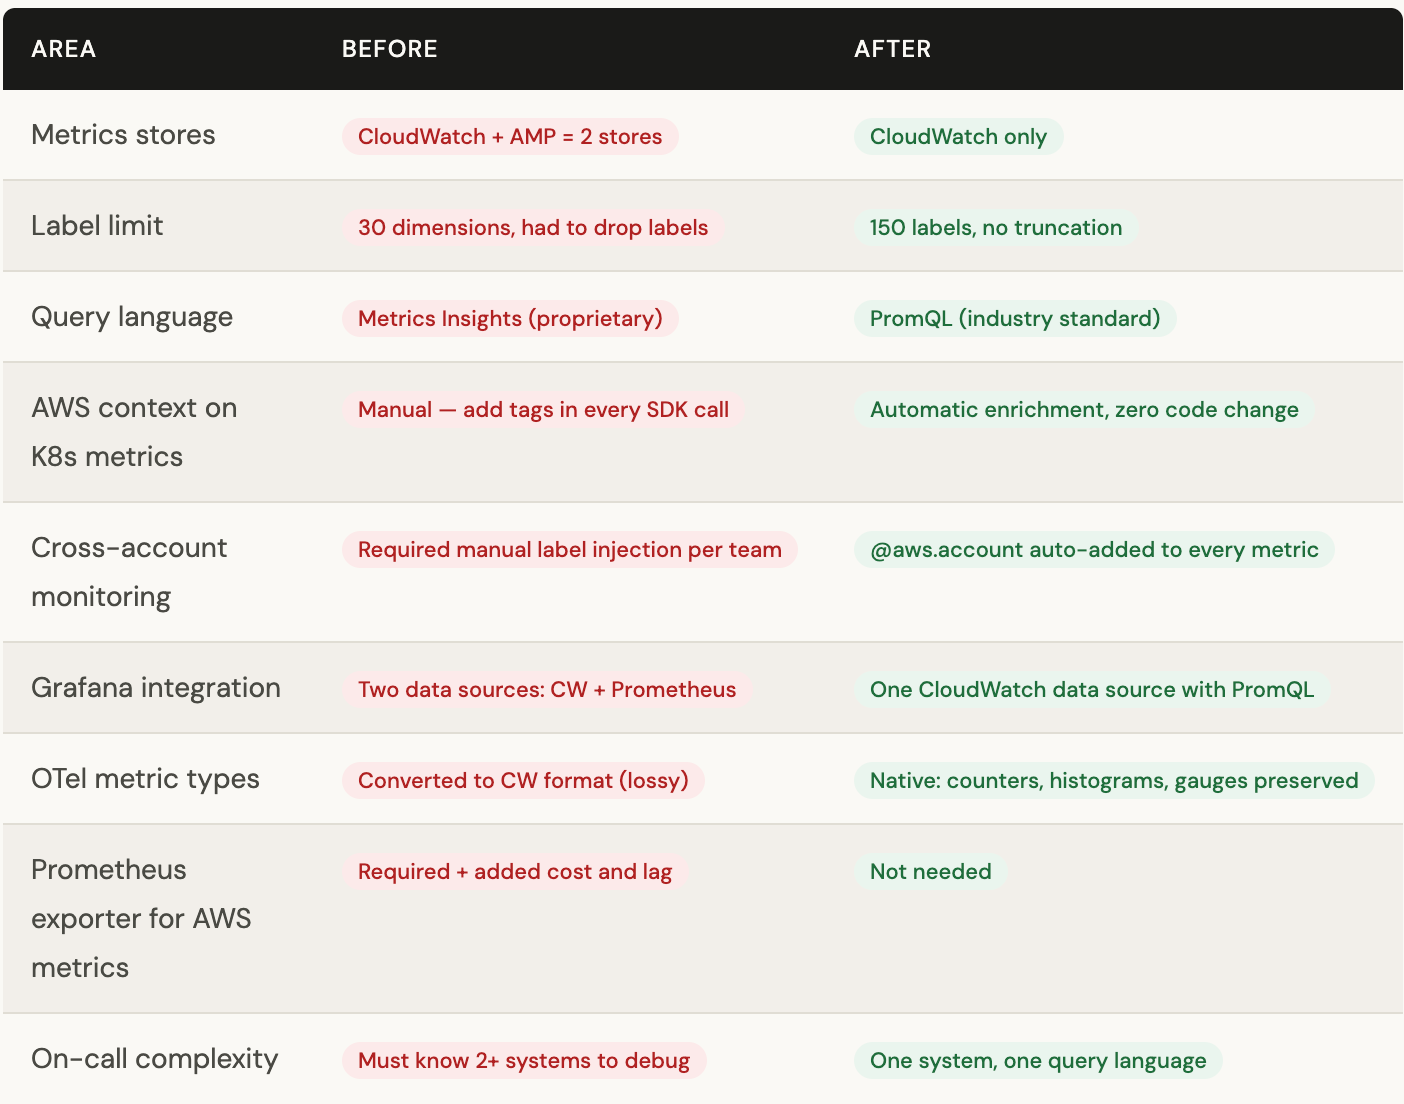
The real win isn’t technology. It’s that your on-call engineer at 2am now has one tab open instead of four.
What This Means for Different Teams
For Platform Engineers
- Simpler telemetry pipelines
- Fewer exporters
- Lower operational overhead
For Developers
- One instrumentation standard
- Easier correlation across logs, traces, and metrics
For SRE Teams
- Reduced MTTR
- Unified query workflows
- Easier debugging during incidents
For Leadership
Improved engineering productivity
Lower operational complexity
Reduced observability sprawl
If you found this article useful, please consider liking, sharing, and following for more deep dives into Cloud, DevOps, Kubernetes, AI, Platform Engineering, and Modern Observability architectures.
This article is still evolving, and I’ll continue expanding it so keep an eye on this post for future updates and additional sections.
If there’s any specific topic you’d like me to cover next, feel free to leave a comment or message me directly. I’d love to explore it in upcoming articles.
Thanks for reading and supporting the journey 🚀

